C2090-621 IBM Cognos Analytics Author V11 Practice Questions
Prepare for C2090-621 with more than an answer.
- Exam fee
- $200 USD
- Level
- Designer
- Valid for
- No expiration - certification does not expire
Domains covered on the exam 5
- Active Reports16%
- Dashboards15%
- Data20%
- Distributing Reports4%
- Reports45%
- 1
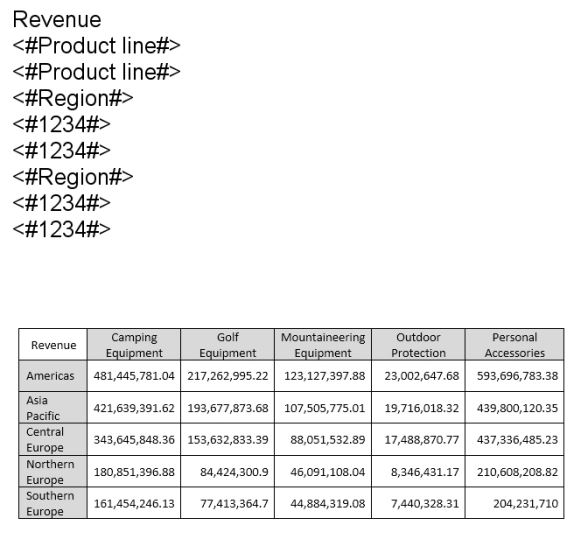
A report author created a crosstab as shown below:
The crosstab report, when run, shows the following data:
The author wants to split the revenue for each region by year.
Where should the year data item be added?
Show answer details
Correct answer: D
D
- 2
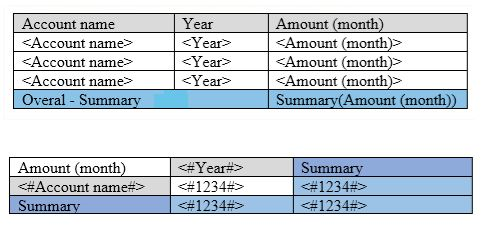
The sales department has requested a change to a tabular account report and wants to be able to analyze the monthly amount of each Account name by Year. The report author changed the original report on left to the report on the right.
How was this done?
Show answer details
Correct answer: A
A
- 3
A report author has the following filter in a report:
[Product line] in ?pline?
The report author adds a Value prompt based on the existing parameter ‘pline’. After adding the prompt, the Auto-submit property is defaulted to ‘No’ and cannot be changed to ‘Yes’.
What is the cause of this?
Show answer details
Correct answer: B
B
- 4
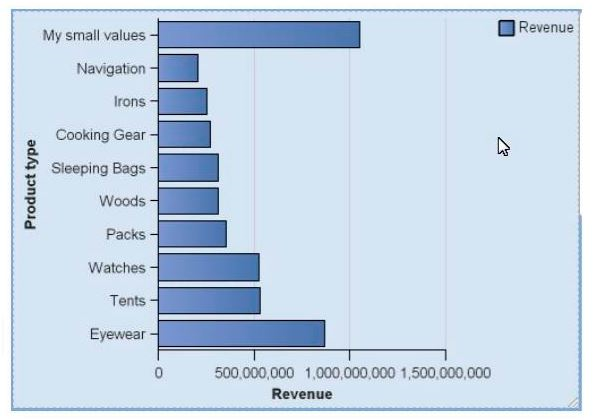
A customer wants to report the product types with the largest average revenue. In addition, the total revenue should be shown and all product types with revenue less than three percent (>3%) in a single bar.
Targeting this result:
How can this be done?
Show answer details
Correct answer: B
B
- 5
You have a list report showing customer details. You need to add a microchart to each row that visualizes the customer's sales trend over the last 12 months. This requires a separate, more detailed query than the main customer list query. How do you configure the report so that each microchart is filtered for the specific customer in its row?
flowchart LR A[Customer List Query (CustID, CustName)] --> B{List Report} C[Sales Trend Query (CustID, Month, Sales)] --> D{Microchart} B --> E((Final Report Row 1: Cust A, Chart A Row 2: Cust B, Chart B)) D --> EShow answer details
Correct answer: C
This is a prime example of a master-detail relationship. The list is the master, and the nested microchart is the detail. By defining this relationship on the detail object (the microchart), you instruct Cognos to re-query the chart's data source for each row of the master list, passing the Customer ID from the current row as a filter. This ensures each microchart displays data only for the customer on that specific row.
- 6
A report author wants to display Revenue and Quantity by Product line in one chart and use a combination chart. A bar chart is used for revenue and a line chart for quantity. While the bar chart is clear and easy to understand, the lines are almost missing and are different to read.
What can be done to solve the problem?
Show answer details
Correct answer: C
C
- 7
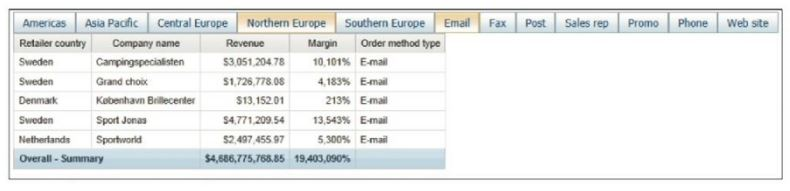
A report author wants to enhance a report by having the ability to display the data by region and filter by Order method (where Order method includes: Email, Fax, Post, Sales rep, Promo, Phone, Web site).
How can this be accomplished?
Show answer details
Correct answer: A
A
- 8
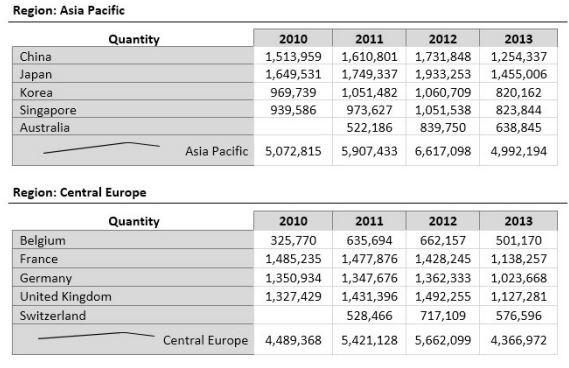
A report author has created a report as shown below:
What has been defined during the building of this report?
Show answer details
Correct answer: A
A
- 9
How can a report author ensure that a report changes automatically when rotating a mobile device between Landscape and Portrait views?
Show answer details
Correct answer: D
Reference: httos://www. ibm.com/develoDerworks/analytics/library/ba-pp-reDorting-active report-page672/ba-pp-reportinq-active_report-paqe672-pdf. pdf (page 1 and 2)
- 10
A report author wants to reduce the number of columns in a list by moving the related information into a single column.
What is the first action that needs to be performed?
Show answer details
Correct answer: B
B
