Certified Six Sigma Black Belt Practice Questions
Prepare for CSSBB with more than an answer.
- Exam fee
- $568 USD
- Level
- Professional
- Valid for
- 3 years
Domains covered on the exam 9
- Organization-wide Planning and Deployment7.3%
- Organizational Process Management and Measures7.3%
- Team Management9.1%
- Define12.1%
- Measure15.2%
- Analyze13.3%
- Improve12.7%
- Control10.3%
- Design for Six Sigma (DFSS) Framework and Methodologies3.6%
- 1
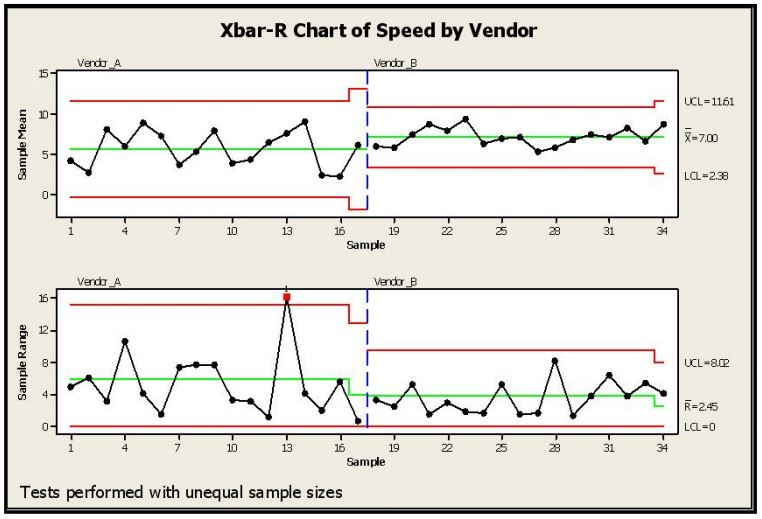
SPC Charts are used extensively in different business and decision-making environments. In this example a vendor is being selected based on speed of delivery. Which of the conclusions would help you pick a vendor for your needs regarding lead-time of delivery from your vendors? (Note: There are 4 correct answers).
Show answer details
Correct answer: B, C, D, E
B, C, D, E
B, C, D, E
B, C, D, E
B, C, D, E
- 2
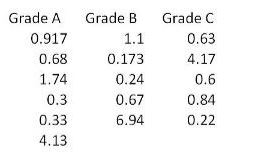
For the data shown here which statement(s) are true? (Note: There are 2 correct answers).
Show answer details
Correct answer: B, D
B, D
B, D
- 3
Early in a project a Belt will want to begin to identify and evaluate risk factors for the subject process and will therefore begin building a(n) ______________.
.Show answer details
Correct answer: B
B
- 4
The distance between the Mean of a data set and the Point of Inflection on a Normal curve is called the _____________.
Show answer details
Correct answer: B
B
- 5
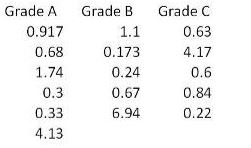
For the data set shown here which of these statements is/are true?
Show answer details
Correct answer: C
C
- 6
Common and _____________ Cause Variation are th© focus of Statistical Procsss Control.
Show answer details
Correct answer: C
C
- 7
A project team used a full factorial DOE to understand the factors affecting the strength of an adhesive bond. The analysis generated the following Pareto chart of the effects. The vertical red line represents the threshold for statistical significance at α = 0.05. Based on the chart, which conclusion is most valid?
graph BT A[Effect] --> B[Standardized Effect] subgraph Chart direction LR C(C: Temp*Pressure) -- 1.5 --> D E(A: Temp) -- 4.5 --> F G(B: Pressure) -- 3.8 --> H I(D: Time) -- 2.9 --> J K(AC) -- 0.8 --> L M(AB) -- 2.2 --> N end subgraph Legend O[Significance Threshold at 2.1] end style D fill:#fff,stroke:#fff style F fill:#f9f,stroke:#333,stroke-width:2px style H fill:#f9f,stroke:#333,stroke-width:2px style J fill:#f9f,stroke:#333,stroke-width:2px style L fill:#fff,stroke:#fff style N fill:#f9f,stroke:#333,stroke-width:2pxShow answer details
Correct answer: C
The Pareto chart of effects visually displays the magnitude of each effect relative to a significance threshold (the red line at 2.1). Any effect whose bar extends past this line is statistically significant. According to the chart, the bars for A (4.5), B (3.8), D (2.9), and the interaction AB (2.2) all cross the 2.1 threshold. The effects C (1.5) and AC (0.8) do not, so they are not considered significant.
- 8
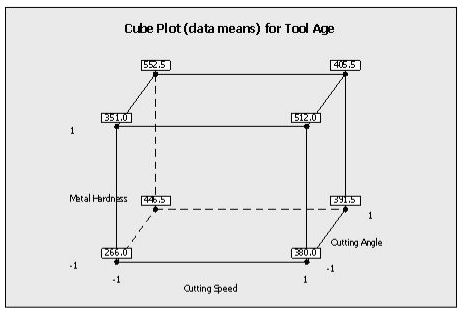
Which statement(s) are correct about the Factorial Plot shown here? (Note: There are 3 correct answers).
Show answer details
Correct answer: A, B, C
A, B, C
A, B, C
A, B, C
- 9
When conducting a Hypothesis Test using Continuous Data the proper sample size is influenced only by the extent to which we need to assess a Difference to be detected but not the inherent variation in the process.
Show answer details
Correct answer: B
B
- 10
Use this data to calculate the Z Score. Average of: 92, Standard Deviation: 2, Upper Spec Limit: 101
Show answer details
Correct answer: D
D
