SAT vs ACT Score Comparison: Official Concordance Table

You have two numbers in front of you: an SAT score out of 1600 and an ACT composite out of 36. They don't share a scale, so you can't tell at a glance which one is stronger. A sat vs act score comparison solves that problem with one tool — the official concordance table — and this walkthrough takes you from raw scores to a single decision about which result to send.
The outcome: one score, expressed on one scale, checked against one target school's published middle-50% range. Below you'll find the prerequisites, the exact lookup sequence, a worked example, verification cues, and the misreads that send students to the wrong conclusion.
What you need before you start
The procedure is short, but it fails if you skip the inputs. Gather these four things first.
Both official score reports. Not a screenshot from a practice test, not a score you remember from a parent portal. You need the SAT total (400–1600) and the ACT composite (1–36). If you took the SAT more than once, use your highest total; if you took the ACT more than once, use your highest composite. Most colleges that consider scores at all look at your best sitting, though a minority superscore across dates.
The official concordance table. ACT and College Board publish it jointly. The ACT to SAT Conversion Chart converts any ACT composite to its SAT equivalent, and the same table works in reverse. Do not use a third-party calculator that applies a formula — the official tables are built from actual score distributions, not arithmetic.
Your target school's middle-50% range. This is the band of scores earned by the middle half of that school's admitted class. It lives on the school's admissions website, usually under "class profile," "admitted student profile," or "first-year class." If the school doesn't publish one, you can't complete step four and you should say so rather than guess.
A note on which test you're comparing. If you took both tests, you'll run the lookup twice. If you took only one, you still need the table — because the school's range may be published in the other test's scale.
One constraint worth stating up front: concordance tables do not predict how you would have scored on the other test. College Board is explicit that a concorded score isn't a forecast of performance, and that the tables are meant to find comparable scores, not equivalent ones. Treat the output as a ranking device, not a prophecy.
Step 1: Confirm which test your target school prefers
Before any conversion, check whether the school publishes its range in SAT terms, ACT terms, or both. This determines which direction you run the table.
Most schools publish both. A few publish only one. If your school lists only SAT ranges and you have only an ACT score, you'll convert ACT to SAT. If it lists only ACT ranges and you have an SAT score, you'll convert SAT to ACT. If it lists both, convert whichever direction gives you the cleaner comparison — usually converting your score into the scale the school leads with.
While you're on the admissions page, note two things you'll need later: whether the school is test-optional or test-required for your application cycle, and whether it superscores. Testing policy has shifted repeatedly since 2020. As of the 2025–2026 cycle, more than 2,000 four-year institutions remained test-optional or test-blind, while Harvard, Yale, MIT, Brown, and Dartmouth reinstated requirements for students applying in Fall 2026, and Cornell followed for Fall 2026 enrollment. That landscape changes year to year, so read the school's current page rather than relying on a list from a previous cycle.
If the school is test-optional and your concorded score sits below its middle 50%, you have a real choice about whether to submit. If it's test-required, the comparison is informational — you're sending the score regardless, and the exercise tells you how much the rest of your application needs to carry.
Step 2: Run the official lookup
Now the actual conversion. Find your score in the left column of the official table and read across to the equivalent in the right column.
The table is a lookup, not a formula. There is no reliable one-to-one equation between the two exams, because the scales were built from different test designs and different populations. That's why the official tables exist and why a generic calculator that multiplies or divides your score will drift from the real answer.
A few anchor points from the published table, so you can sanity-check whatever you look up:
| ACT composite | SAT equivalent (approximate band) |
|---|---|
| 36 | 1570–1600 |
| 34 | 1490–1520 |
| 30 | 1370–1390 |
| 25 | 1210–1240 |
| 20 | 1030–1060 |
Notice that the SAT column is a band, not a single number. That's not sloppiness — it reflects the reality that a range of SAT scores corresponds to the same ACT composite. When your school's range is a band too, you're comparing band to band, which is the honest way to do it.
If you'd rather not hand-look-up a value, the SAT to ACT Score Conversion tool applies the same official data, and the SAT ACT Concordance reference lays out the full table alongside the digital SAT and PSAT equivalents. Both are secondary presentations of the primary tables, so if a number looks off, go back to the source.
Verification cue: your converted score should land inside the band shown for your original score, and converting back should return you to your starting number or one adjacent value. If a conversion moves you 60+ SAT points away from the published band, you've misread a row.
Step 3: Put both scores on one scale
This is the step people skip, and it's the one that produces the decision.
Say you scored 1350 on the SAT and 29 on the ACT. Look up 29 in the ACT column: it maps to roughly 1330–1350 on the SAT. Your two scores are effectively the same. There's no advantage to sending one over the other on the basis of strength alone.
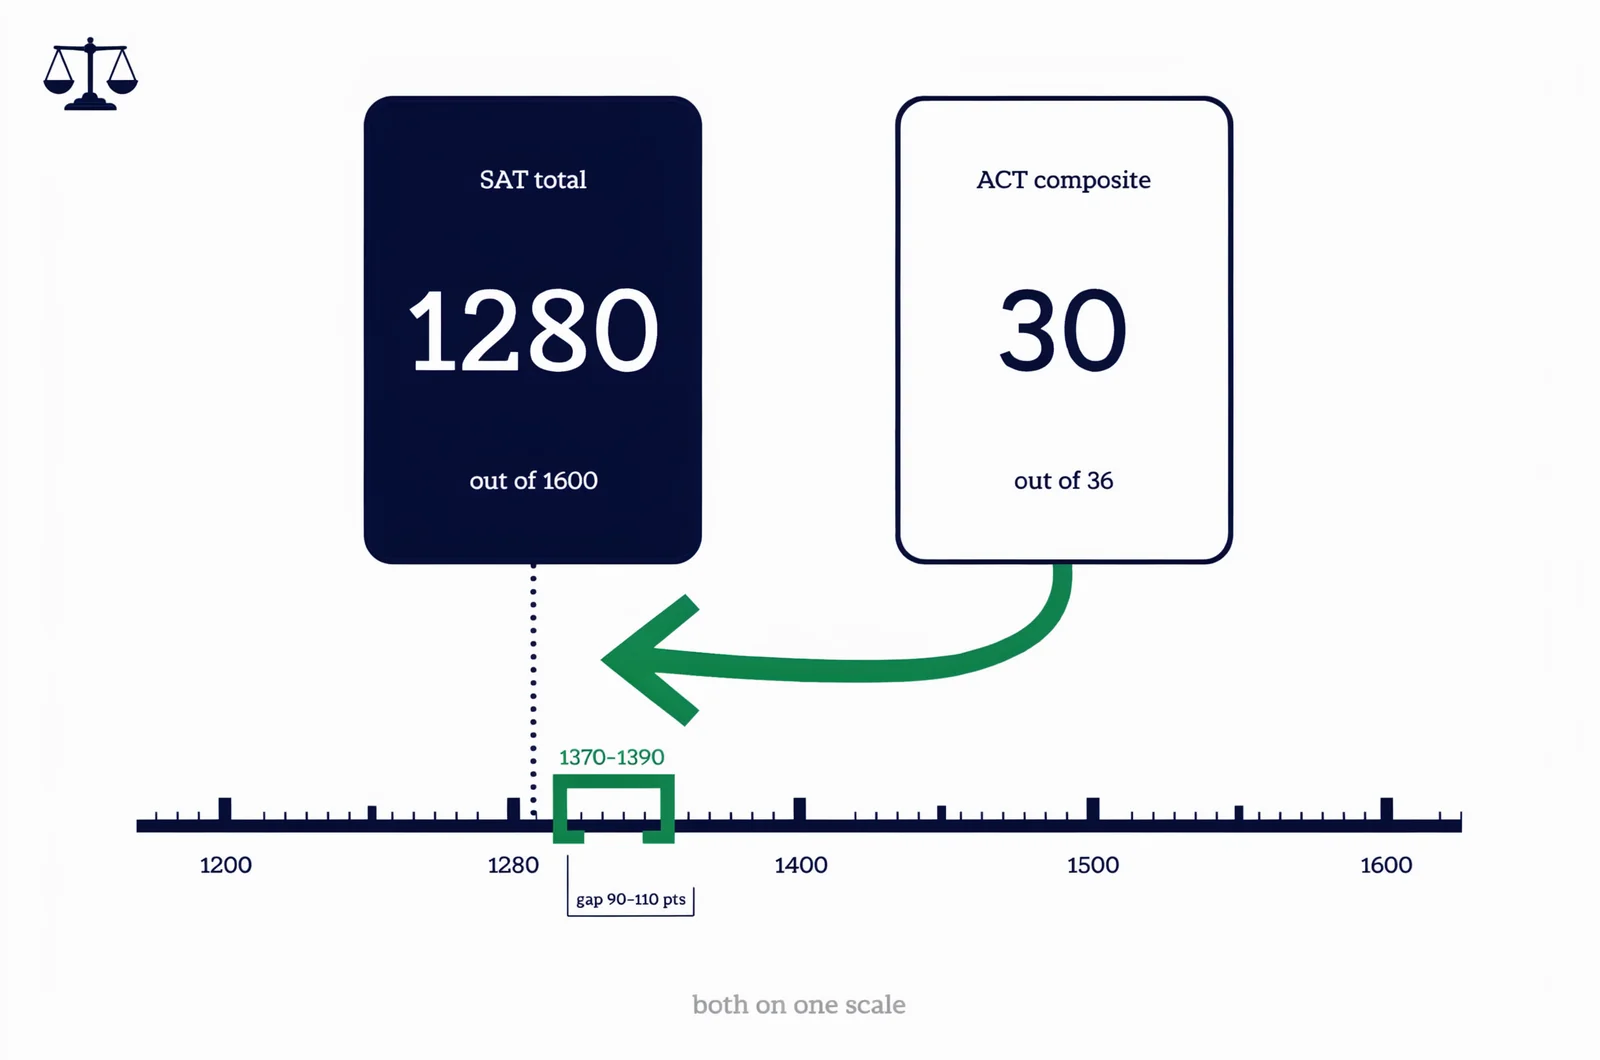
Now change the numbers. Say you scored 1280 on the SAT and 30 on the ACT. A 30 maps to roughly 1370–1390. Your ACT score is meaningfully stronger — about 90 to 110 SAT points stronger. That's the finding that drives your submission choice.
Write both values down in the same scale before you compare anything. Comparing a 1350 to a 29 without converting is comparing inches to centimeters.
If you're weighing whether to retake one of the tests to close a gap, the same table tells you how many points you'd need. A student at 1280 SAT trying to match a 30 ACT needs roughly 90–110 more SAT points, which is a substantial jump. A student at 1330 SAT trying to match a 30 ACT needs about 40–60 points, which is a realistic single-retake target. That framing turns a vague "should I retake?" into a number.
Step 4: Compare against the school's middle 50%
With one scale in hand, place your score against the school's published band.
Three outcomes are possible, and each implies a different action.
Above the band. Your score is a strength in the application. Send it. If the school superscores and you have a higher section score from another sitting, check whether the superscore moves you further up.
Inside the band. You're competitive on this measure. The score neither helps nor hurts much, so the decision about whether to submit turns on the rest of your file — and, at a test-optional school, on whether submitting adds information. A score in the middle of the band usually does.
Below the band. At a test-optional school, this is where you weigh going score-free. At a test-required school, the score is going in, and the useful takeaway is how much weight the rest of your application needs to absorb. Either way, don't convert a below-band score into a prediction about admission. The middle 50% describes the enrolled class; a quarter of that class scored below it.
One caution on the school's published range: verify which test scale it uses and which year it covers. A range labeled "SAT" from a 2019 profile reflects a pre-digital test and a different applicant pool. Where a school publishes a range without a date, treat it as approximate.
Step 5: Decide which score to send
The decision rule is short.
Send the score that is stronger after conversion, unless the school is test-blind (in which case scores aren't considered at all) or you're applying test-optional and both scores sit below the band.
If both scores convert to the same place, send the one that fits the school's stated preference, or the one with the stronger section breakdown if the school considers sections. If the school requires a specific test — a small number of programs do — that requirement overrides the strength comparison.
If you're applying to several schools with different policies, build a simple table: school name, policy for your cycle, published range, your concorded score, send-or-not. Five rows is usually enough to see the pattern. The SAT and ACT Comparison page from College Board is the right place to confirm the current table before you finalize anything, since it's the primary source both testing companies point to.
Misreads that flip the answer
These are the errors that produce a confident wrong conclusion.
Converting a section score with the composite table. The concordance table maps composites to totals. An SAT Evidence-Based Reading and Writing score of 700 is not comparable to an ACT English score of 35 through this table. Section-level concordance is a separate exercise, and mixing the two produces nonsense.
Converting an average, median, or range. College Board's guidance is explicit: don't use the tables to convert aggregate scores. If a school's mean SAT is 1400, you cannot convert that to an ACT mean and compare it to your composite. The table is built for individual scores.
Treating the concorded score as a prediction. A 30 ACT does not mean you would have scored 1370–1390 on the SAT if you'd taken it instead. It means your 30 sits at the same rank within the testing population as that SAT band. Different test, different day, different result.
Using an outdated table. The current tables were developed after the 2016 SAT redesign and remain the reference point. If a calculator you find is built on the old 2400-point scale, its output is wrong for the current test. Check the scale before you trust the number.
Ignoring the band. A single-number conversion invites false precision. If your school's range is 1330–1480 and your concorded score is 1320, you are at the edge of the band, not clearly outside it. Report the band, not a point.
Building the score you want to compare
The comparison procedure is only useful if you have scores worth comparing, and that's where practice habits matter more than test choice.
Students who improve fastest tend to work from exam-aligned questions with explanations attached, not from answer keys alone. The difference is whether a wrong answer teaches you the underlying rule or just tells you it was wrong. Working through ACT practice questions in short, focused sessions — twenty minutes on a weak section rather than a three-hour block you'll skip — builds the pattern recognition the test actually rewards.
That's the approach behind Quizra's question-first library: independently authored, exam-aligned questions with integrated explanations, searchable by exam or goal, built for the brief study windows that fit around a job or a full course load. If you're deciding between the two tests and haven't committed yet, the ACT vs. SAT: Which Test breakdown from ACT covers the structural differences, and the SAT vs ACT: Which Test comparison from Princeton Review covers timing and section format. Pick the test that fits how you think, then practice it consistently rather than splitting effort across both.
If you want a concrete tool for the decision itself, build a one-page score worksheet: two columns for your raw scores, a row for the concorded value, a row for the target school's range, and a final row that says send or don't send. Fill it in once per school. It takes about ten minutes and removes the guesswork.
Questions that come up during the comparison
Is the SAT or ACT easier to score well on? Neither is easier in the abstract. The scales and populations differ, which is exactly why the concordance table exists. The practical question is which format suits you: the SAT gives more time per question, while the ACT moves faster across more sections.
Can I convert my PSAT score to an ACT score? The concordance tables are built for the SAT and ACT. PSAT scores sit on a different scale and shouldn't be run through the SAT/ACT table. Use PSAT results as a practice signal, not as a comparable score.
Do colleges convert my score themselves? Admissions offices use the same official tables when they need to compare applicants across tests. You're not doing anything unusual by running the conversion — you're doing what the reader on the other end will do.
What if my two scores convert to the same value? Send either. At that point the choice comes down to the school's stated preference, your section-level strengths, or which score report you've already paid to send.
How current is the concordance table? The tables in use today were developed after the 2016 SAT redesign and remain the reference point for both testing companies. Confirm the current version at the source before you rely on a number, since third-party pages sometimes republish older scales.
Where to go next in your prep
- ACT practice questions
- C-ABAPD-2309 vs E-ABAP: Which SAP ABAP Path to Take
- CFA Level 3 Exam Format: What the Essay Section Actually Tests
Click through to browse exams and begin a practice session. Get started → |